
04Policy · Data storytelling · Editorial systems2017–2020
NACo
National policy.
County-level clarity.
At the National Association of Counties (NACo), I translated complex policy, finance, and live-response data into clear communication for county leaders.
- Role
- Graphic & Digital Designer
- Team
- Communications + Legislative
- Focus
- Reports, presentations, web, analytics
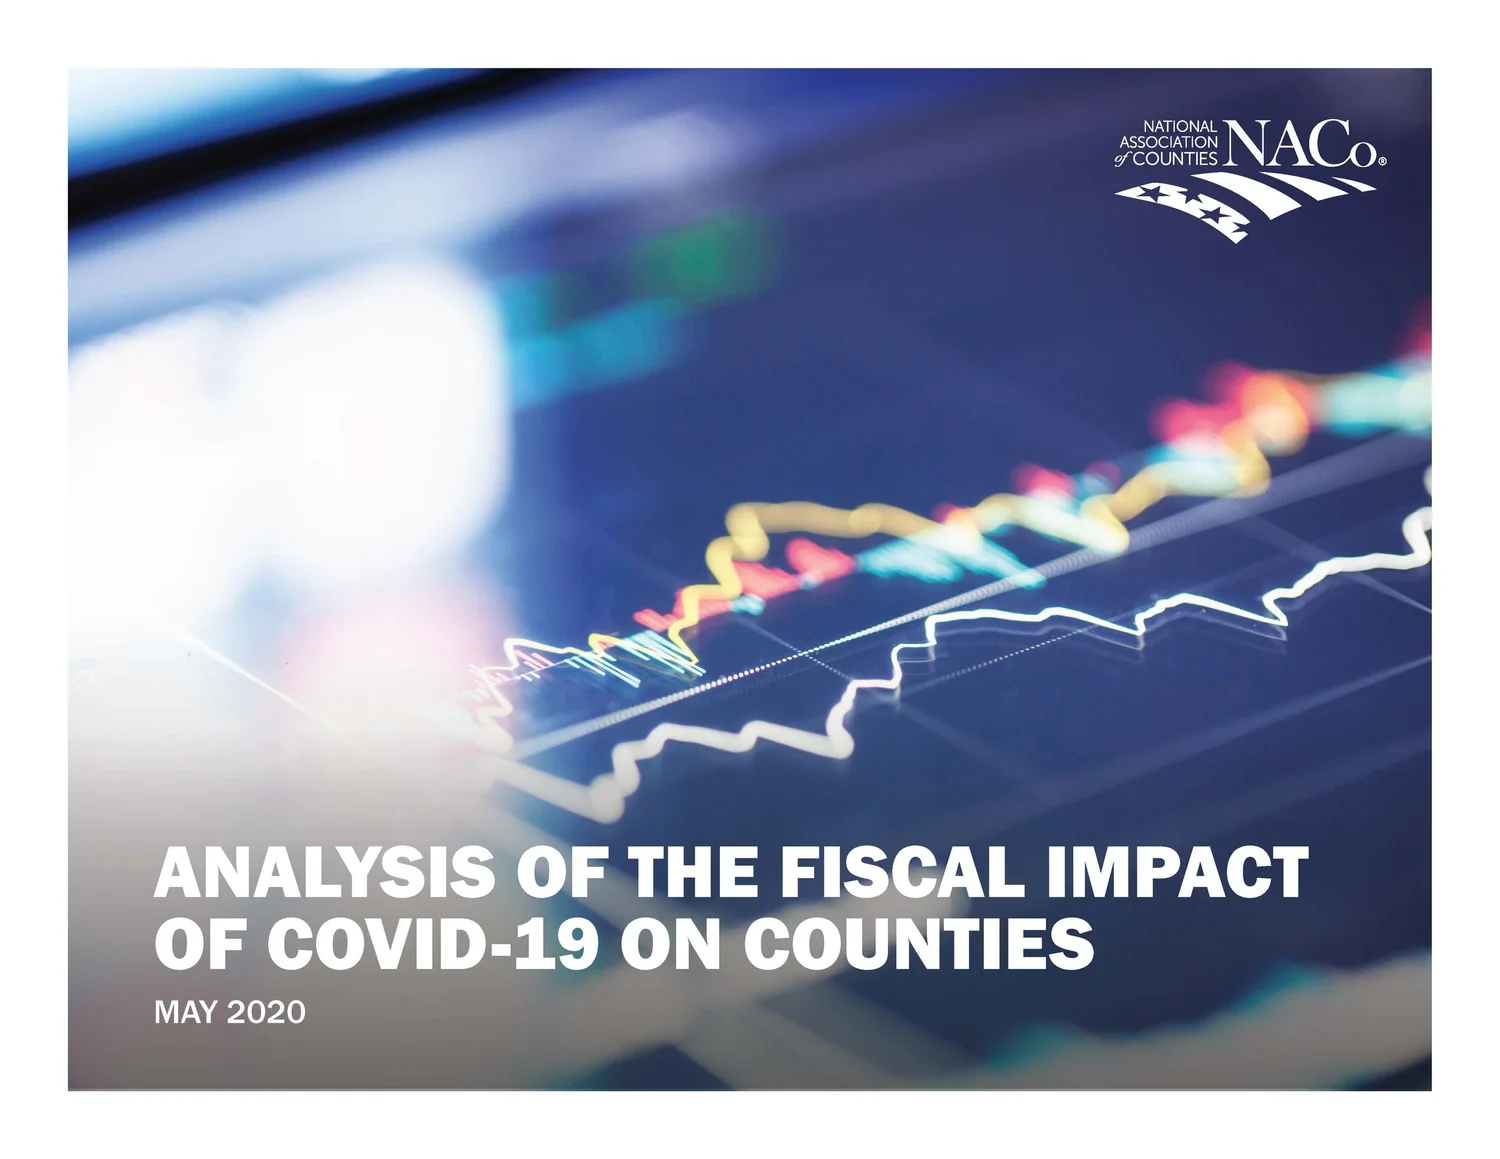
May 2020 / Live-response publishing
30working hours from live data to a polished 60+ page editorial.
Produced across three days in close partnership with the legislative department.
The communication gap
Make Washington policy useful beyond Washington.
Rural and urban county leaders were navigating unfamiliar legislation, emergency funding, and rapidly changing public-safety guidance. The work had to preserve policy accuracy while making the implications comprehensible, timely, and easy to share.
Audiences ranged from nearly 1,800 county officials to federal partners, House leaders, White House stakeholders, and Justice & Public Safety audiences. Each needed a clear view of what the data meant—and what to do next.
Editorial response
The design system had to move at the speed of the information.
The challenge was not simply laying out a report. It was learning specialized subject matter quickly, partnering with policy experts, identifying the story inside changing data, and extending NACo’s brand without slowing the publishing window.
Three-day production sprint
Live data in.
National report out.
- 01Receive
Live finance, workforce, and response data arrived as the national picture continued to change.
- 02Align
Legislative experts clarified the policy context, priority findings, and implications for counties.
- 03Translate
Dense findings became maps, charts, editorial hierarchy, and concise explanations.
- 04Publish
A polished 60+ page report and executive summary were prepared for national distribution.
Selected report system
One visual language.
Three urgent questions.
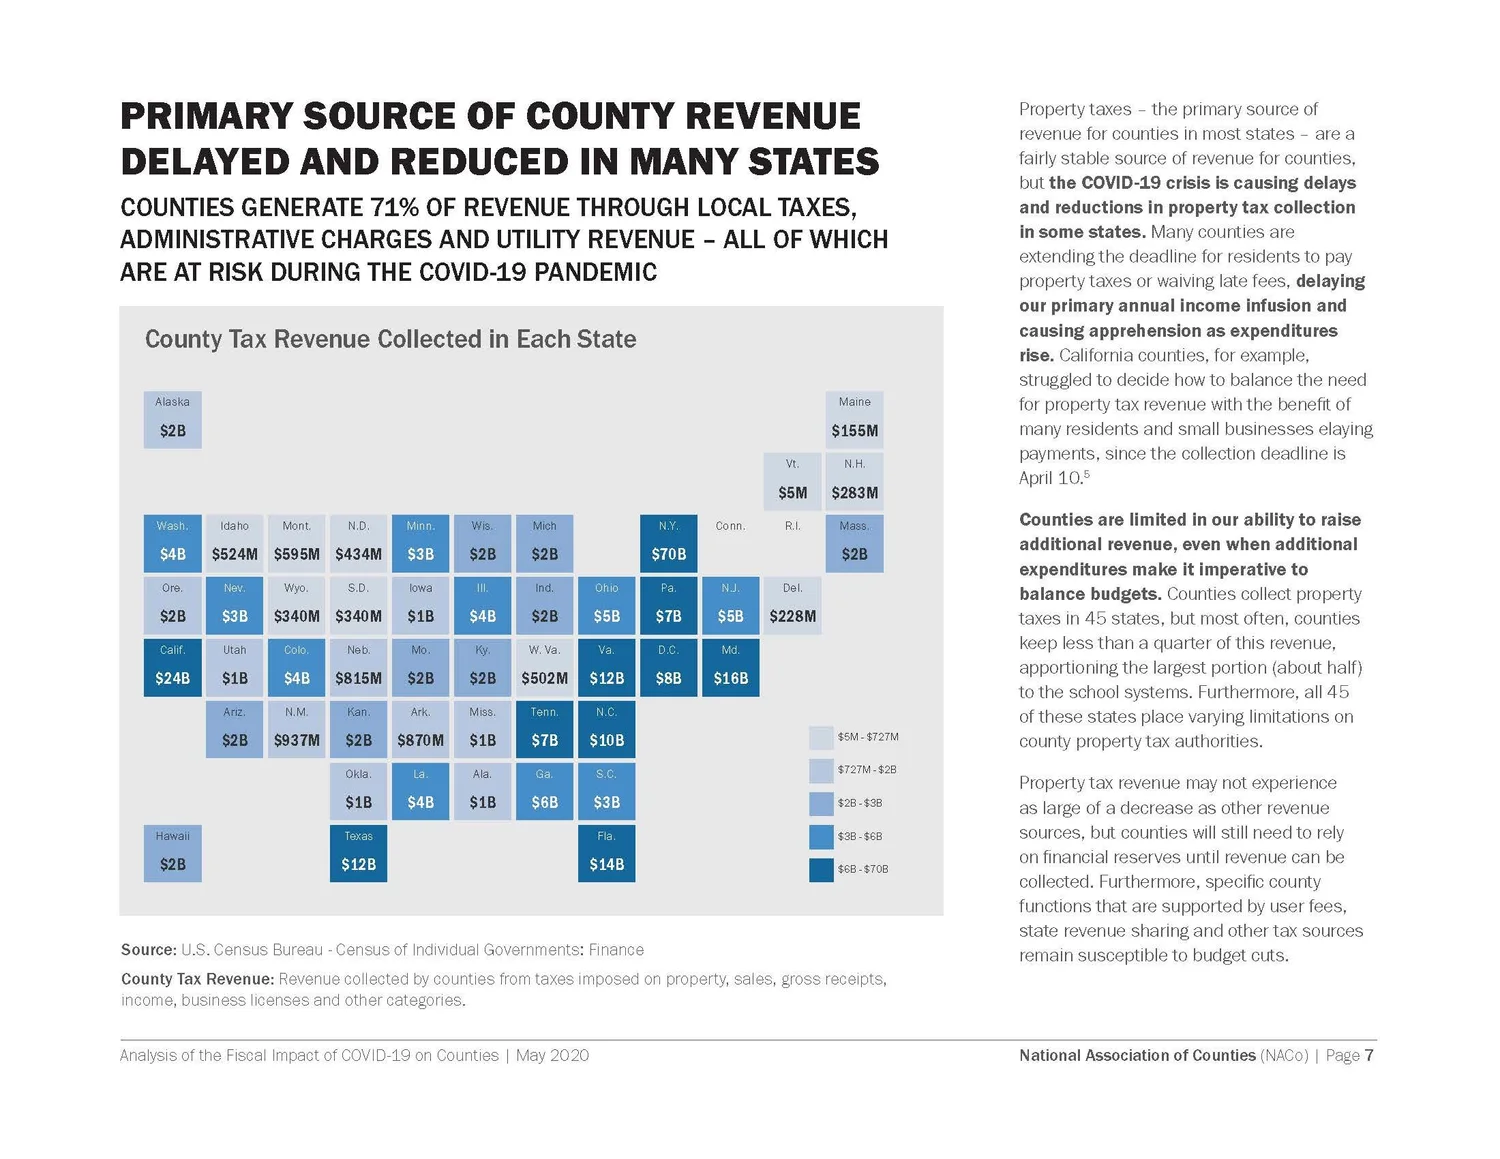
Analysis
Show where county revenue was most exposed.
Financial findings were organized around the decisions county leaders needed to make—revenue risk, delayed collections, emergency costs, and the resources required to respond.
Analysis of the Fiscal Impact of COVID-19 on Counties / May 2020
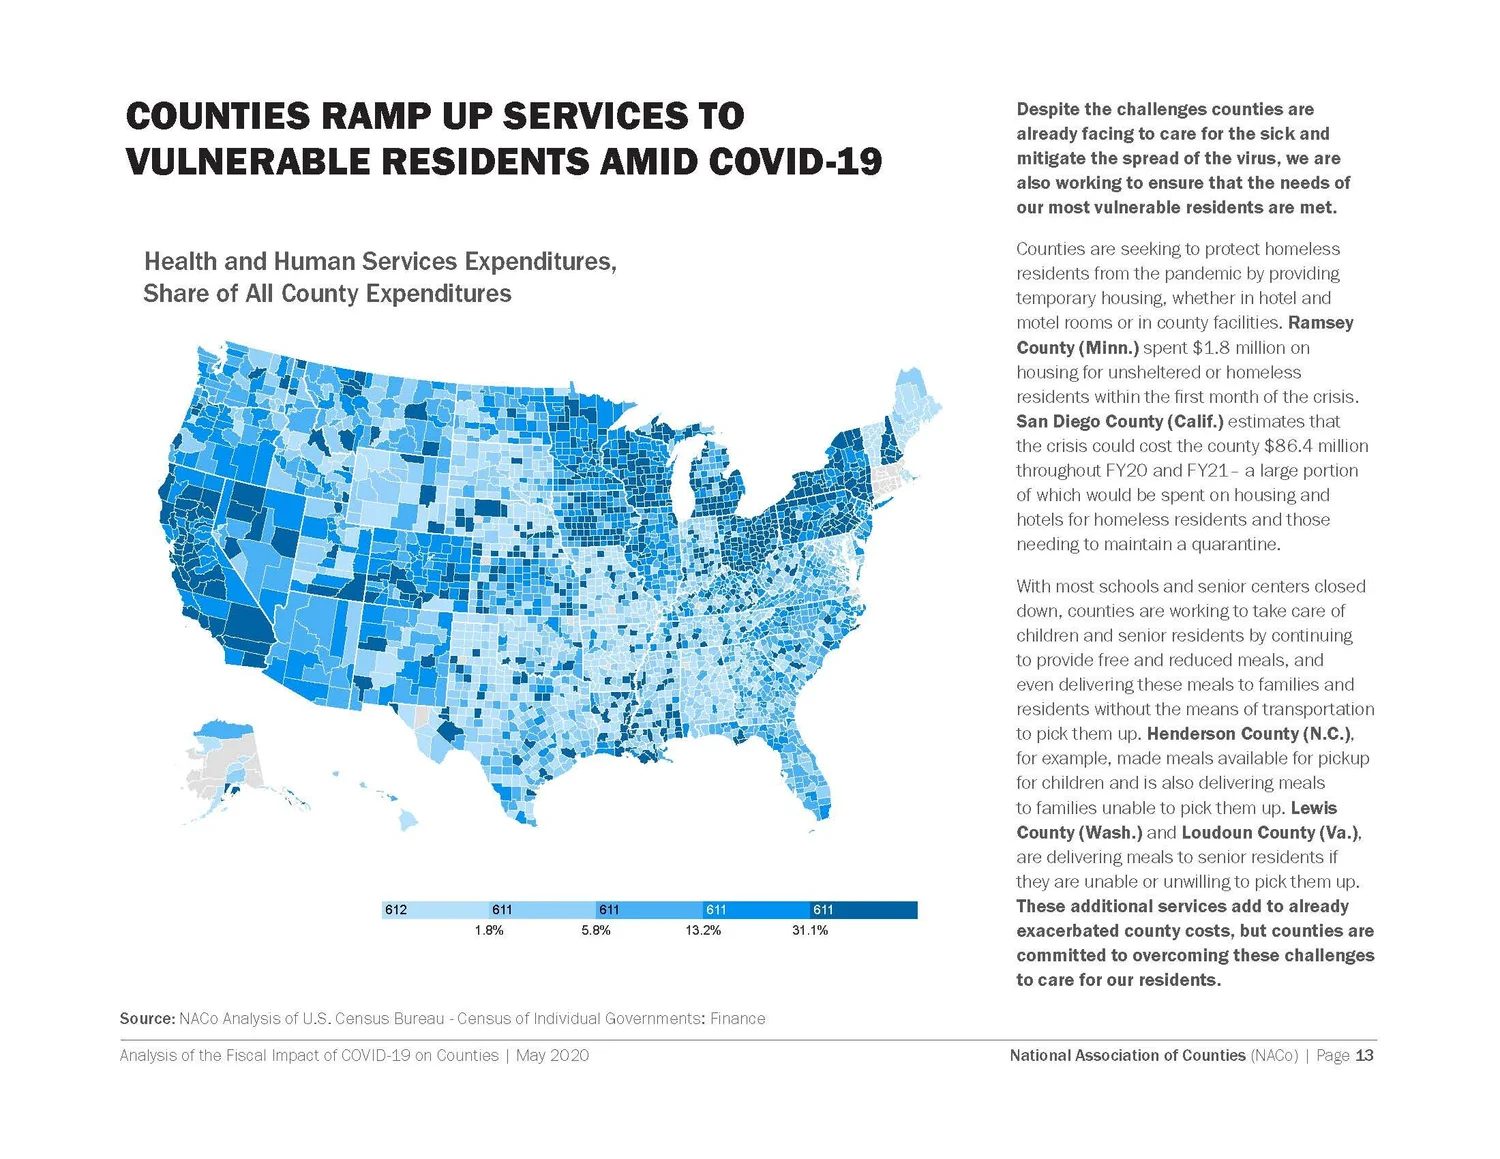
Policy brief
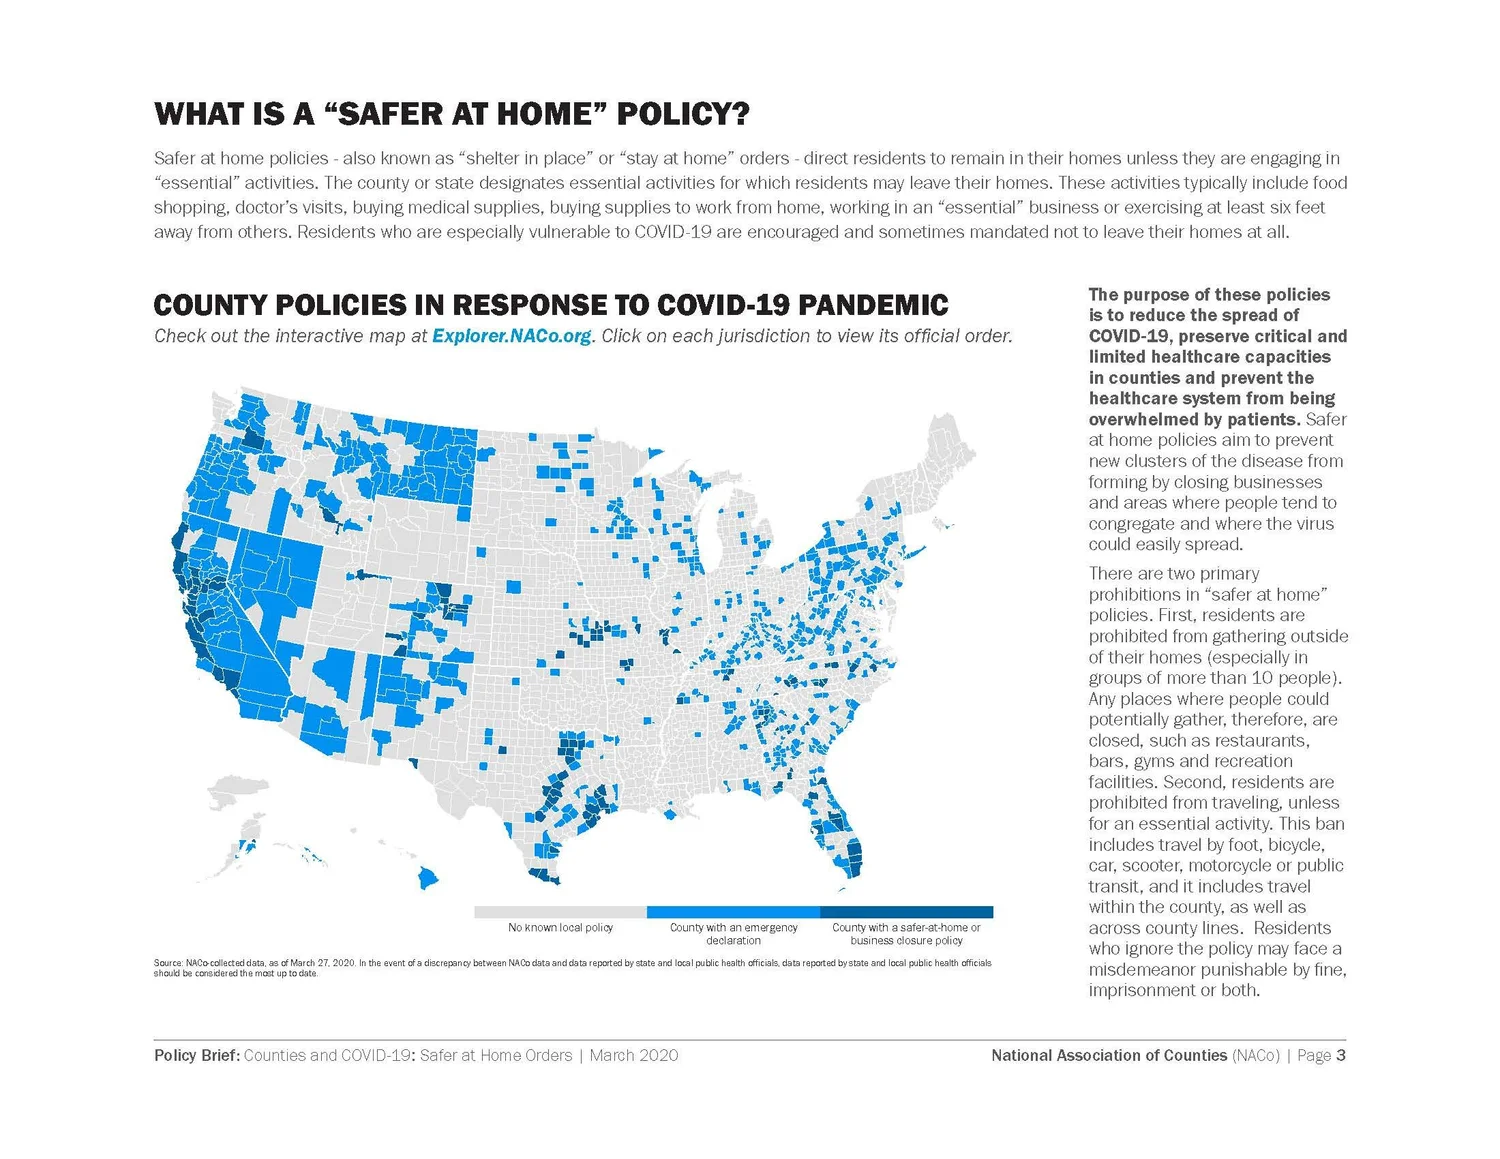
Turn a changing policy landscape into a readable map.
The policy brief connected national guidance with local implementation, using geographic data to help readers understand where county responses differed and why.
Counties and COVID-19: Safer at Home Orders / March 2020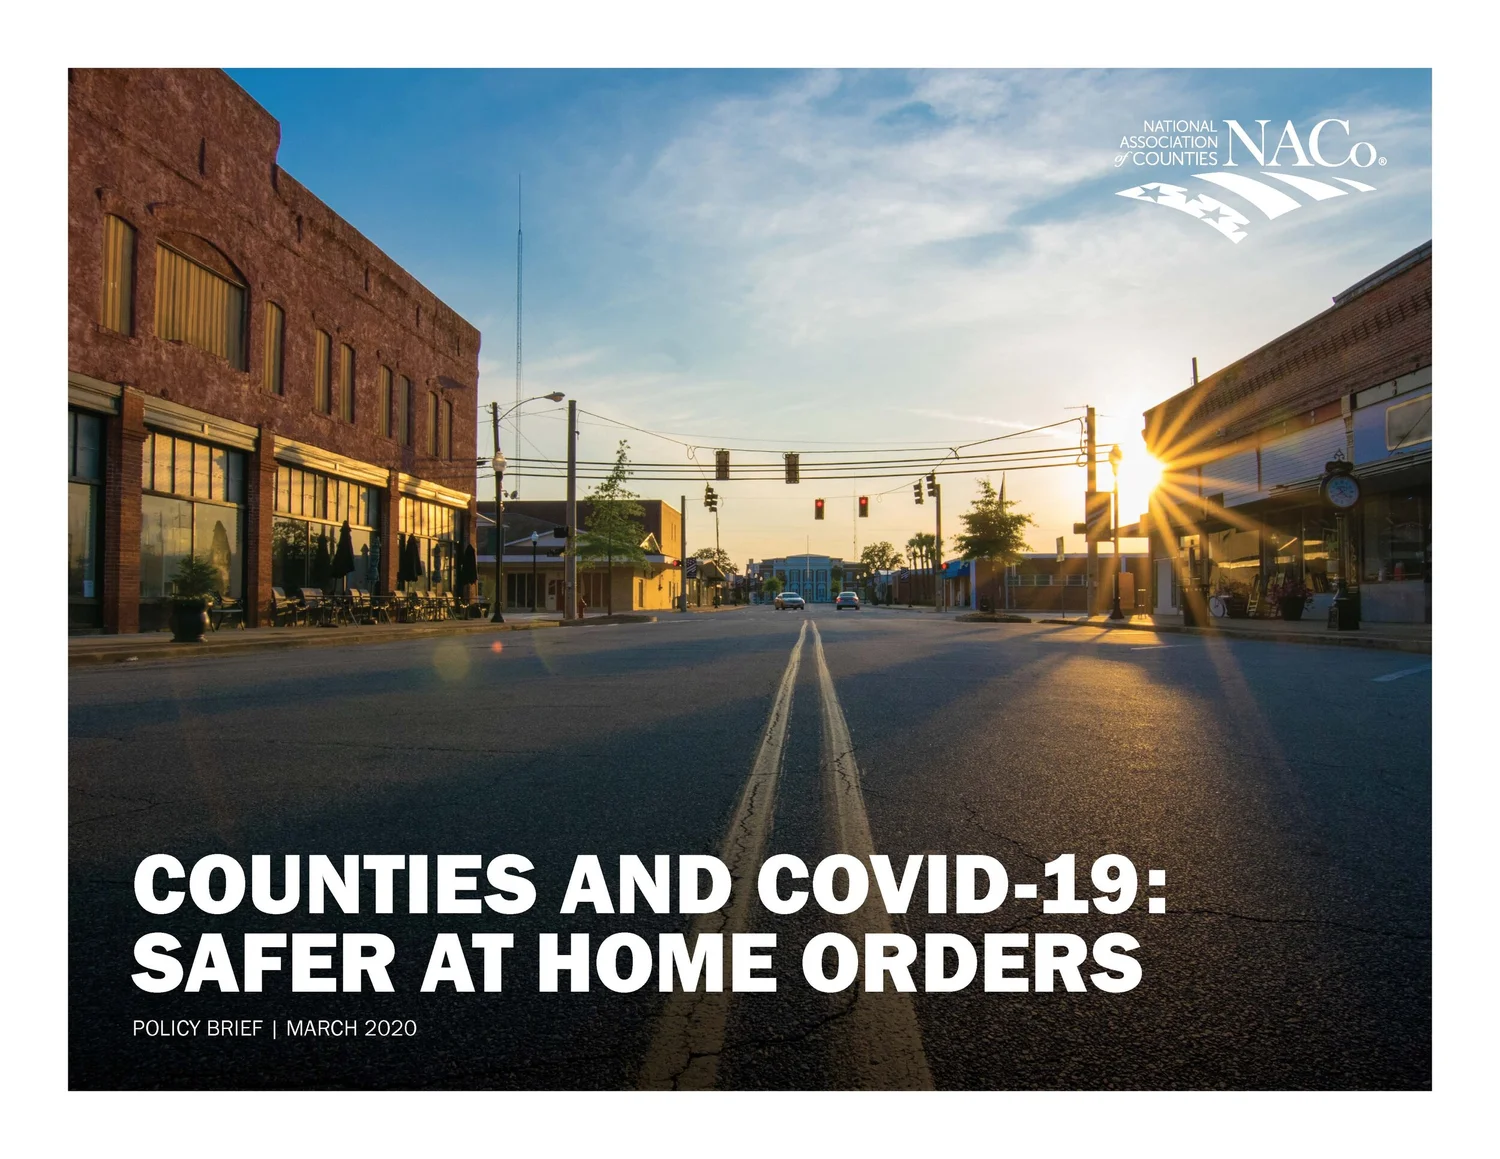
Workforce report
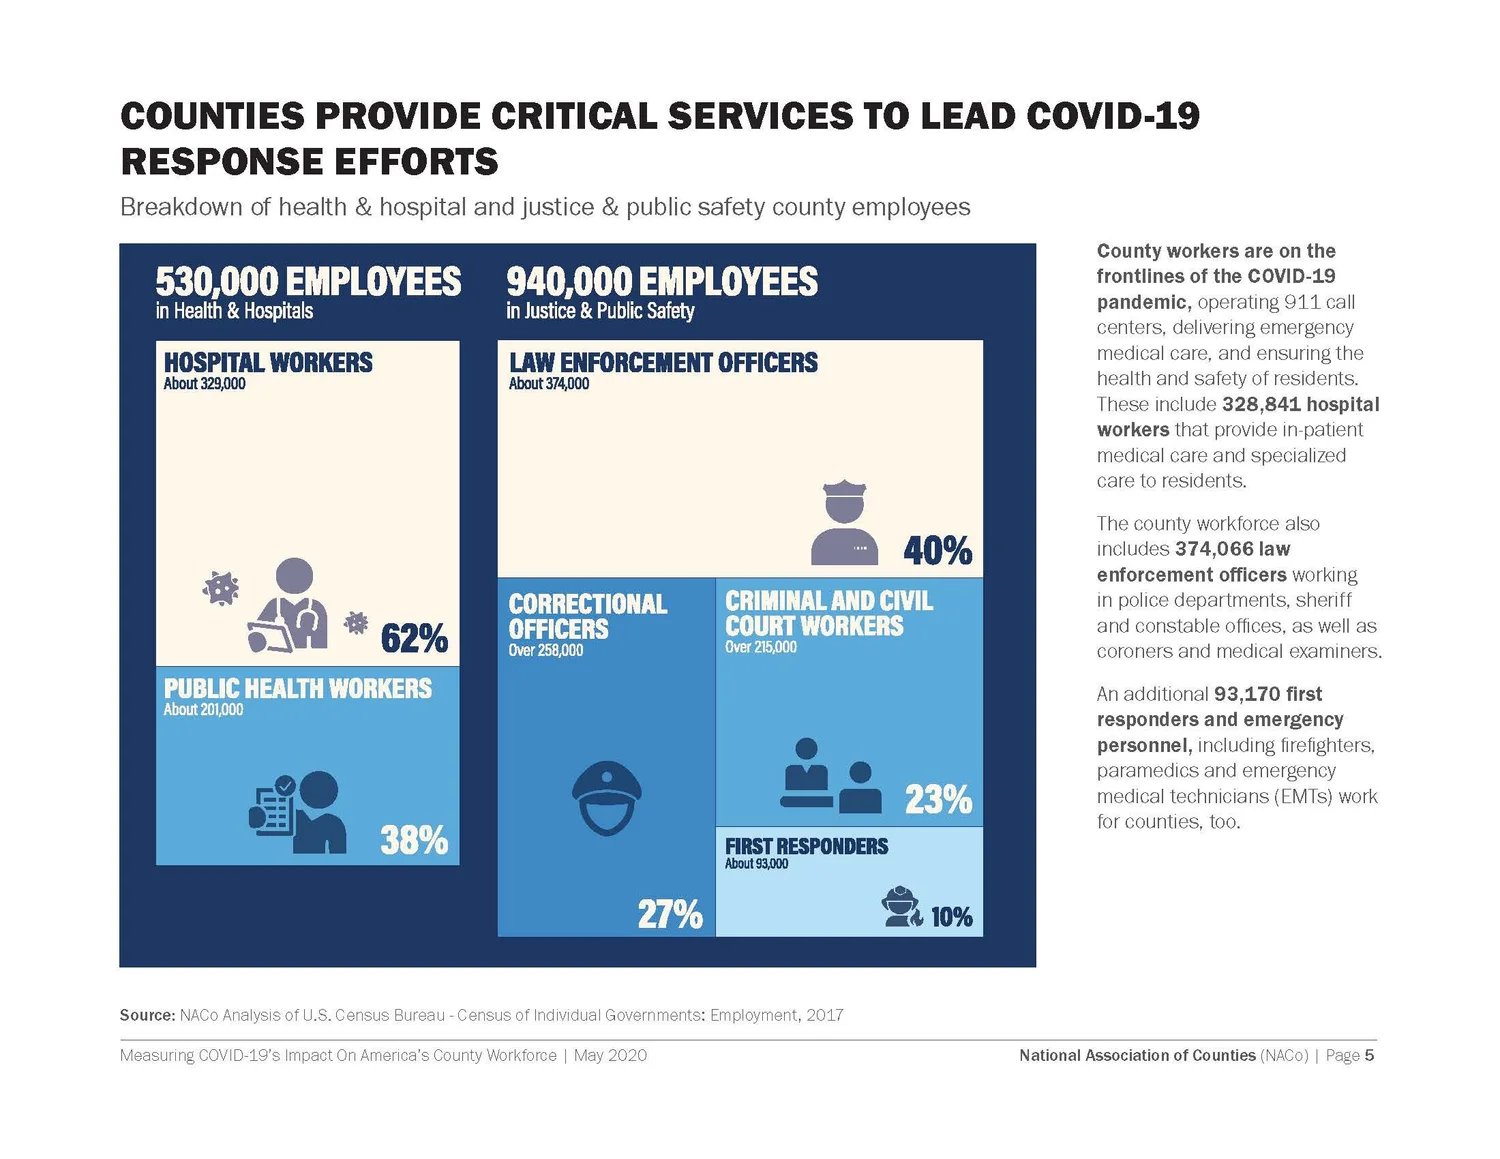
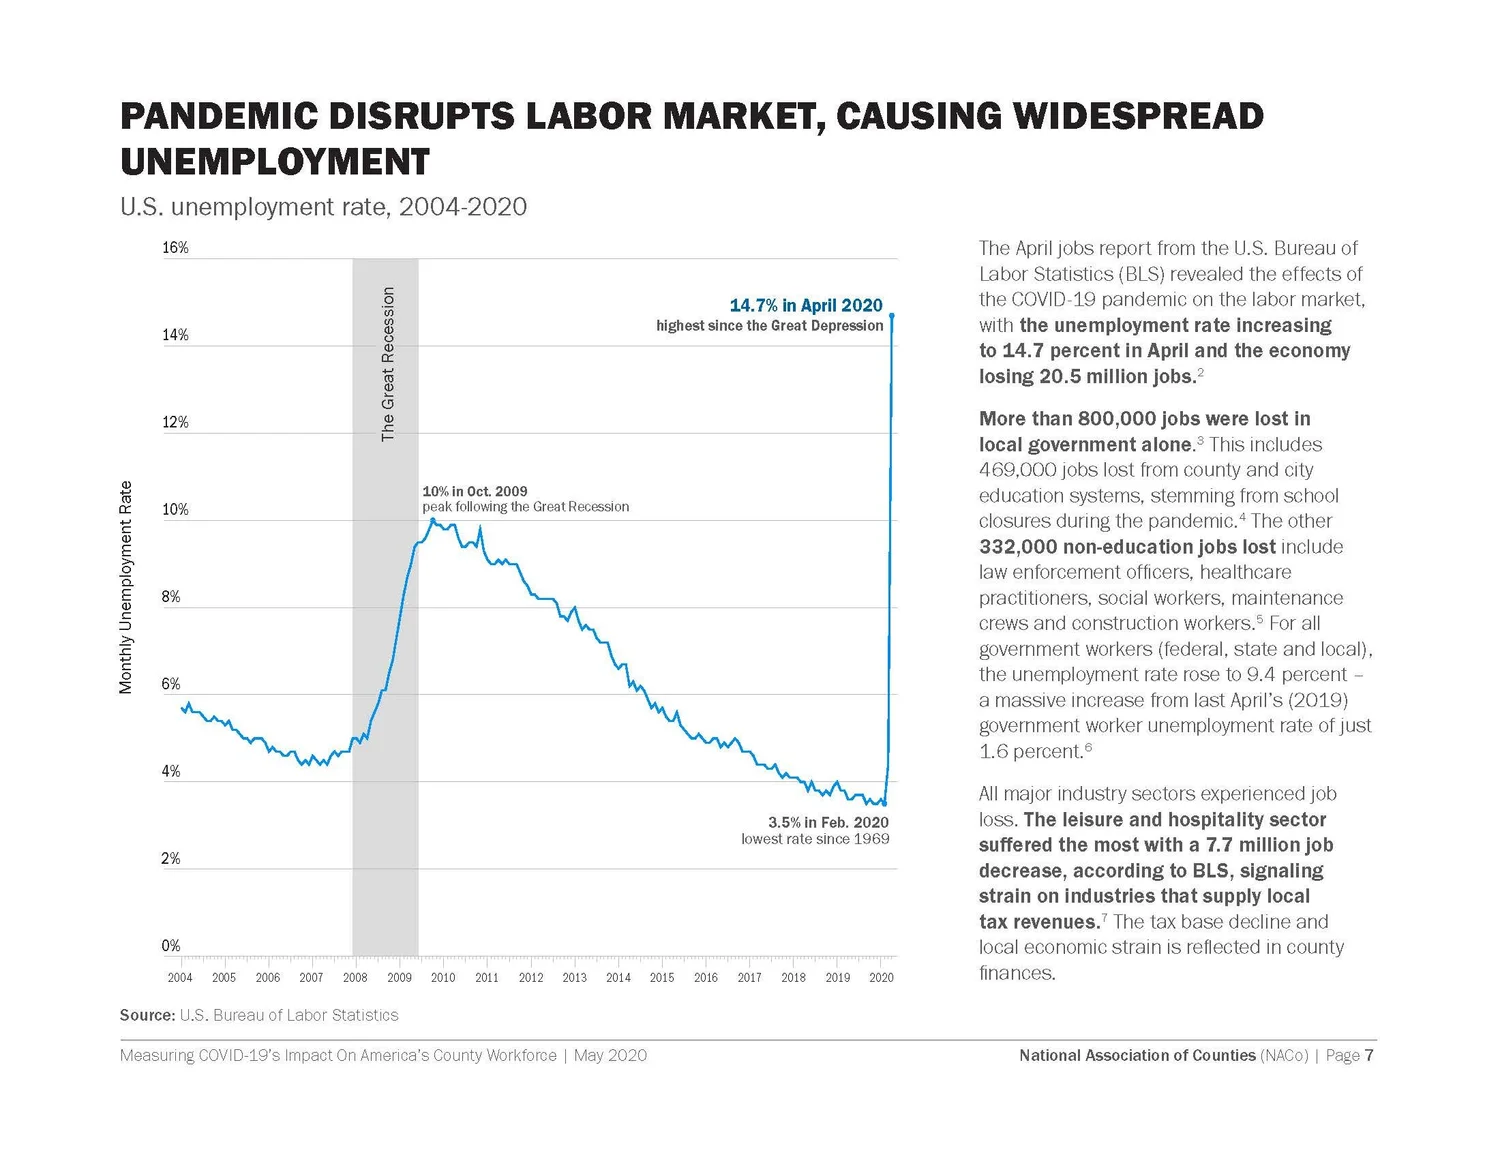
Connect national employment data to essential local services.
Workforce statistics became a story about people: health professionals, law enforcement, first responders, and county teams maintaining critical services during the crisis.
Measuring COVID-19’s Impact on America’s County Workforce / May 2020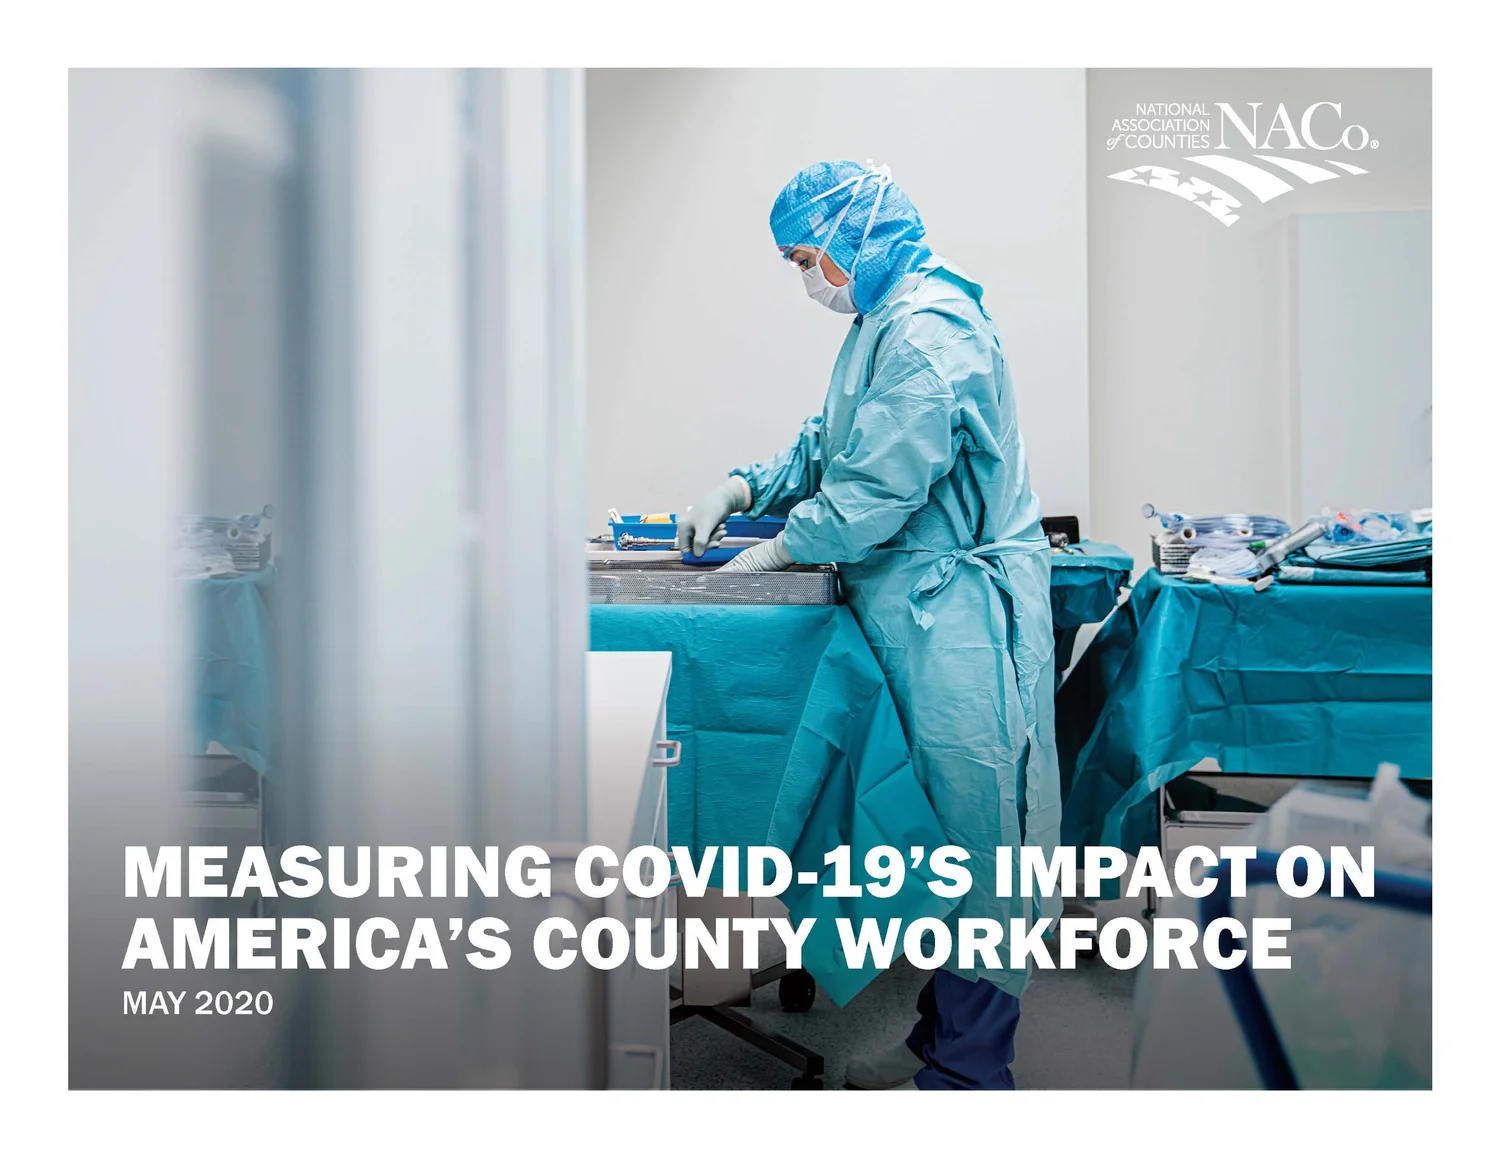
System thinking
A bridge between policy expertise and local action.
Research, analytics, editorial design, presentations, web production, signage, and wayfinding extended the same brand logic across government and private-sector partners, including the Gates Foundation and Walmart. Analytics from the work also informed conversations on the Senate floor and in White House settings.
Washington, D.C.Policy + live data
National networkClear reports + tools
County leadersLocal decisions + action